Content
The service is based on 3 pillars: Content, Evolution, Alert
An indicator allows the user to know the richness of the OSM database and of each cell of the grid (10x10km in freemium, 1x1 in premium), and to detail some specific contents (buildings, roads, points of interest - amenities).
Evolution
From the content indicator, the user can calculate and visualize the evolution of the database between two selected dates. At the cell level, the user can analyze the objects created or deleted and their nature. The evolution also highlights the previously blank areas where the first elements have just been mapped (in green).

Alerts
From the evolutions, a configurable alert mechanism informs the user of major evolutions related to his centers of interest (thematic or geographic). The default alert frequency is monthly, but can be customized on demand with the Premium service.
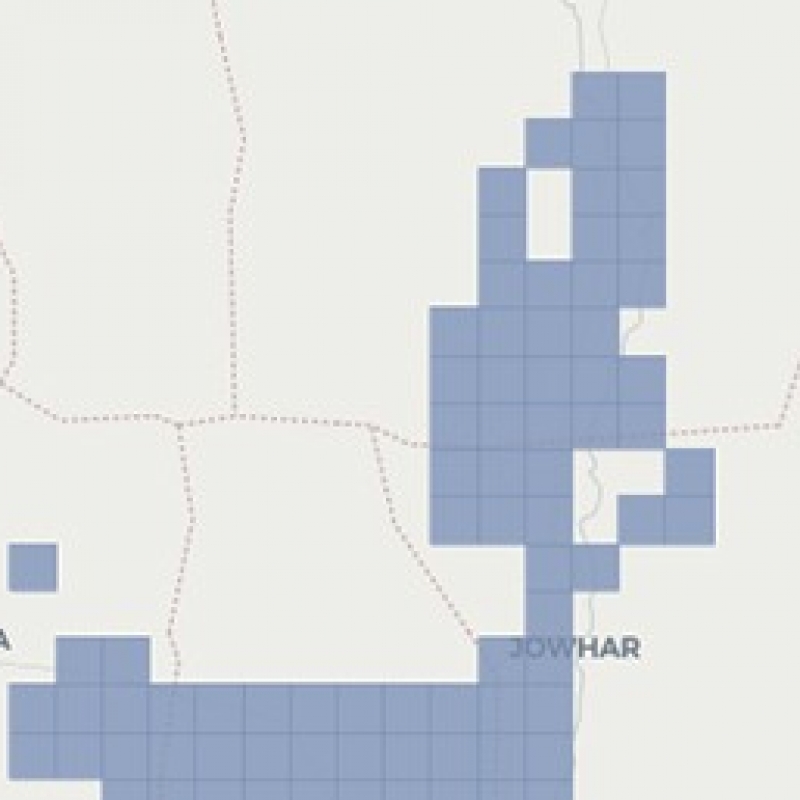
Figure
Example of an alert - 76,964 buildingsadded in February 2021.
Contact us for more information. Ask for a personalized demonstration and/or an adaptation of the service to your needs (targeted area anywhere in the world, adapted frequency, specific themes). The architecture of our back office allows us to adapt to all your requests to provide a personalized and secure service.
To contact Geo212 or get a quote: contact@geo212.fr
Designed by Geo212 and developed in partnership with Geoide Crypto&com.